 Protovision
Recording
In short: ProtoTTD, Record, pick the program, use it, close it. The capture opens by itself and is kept in Documents\Protovision\runs. This chapter says what else you can do, and what exactly is recorded.
In the window
The front page has three tabs: Record a program from its start, Attach to one already running, Open a capture.
Record
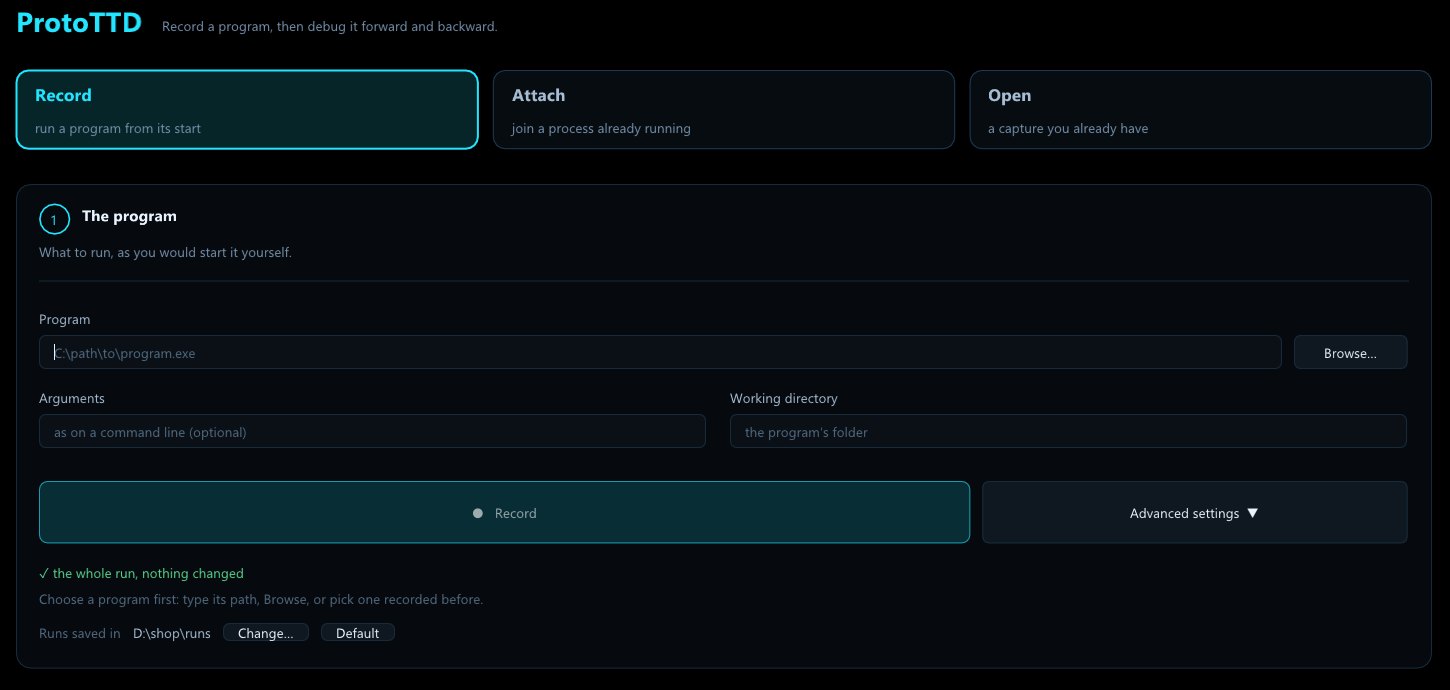
- 1The program: its path (Browse…, or one recorded before from the list), its arguments, the folder it starts in.
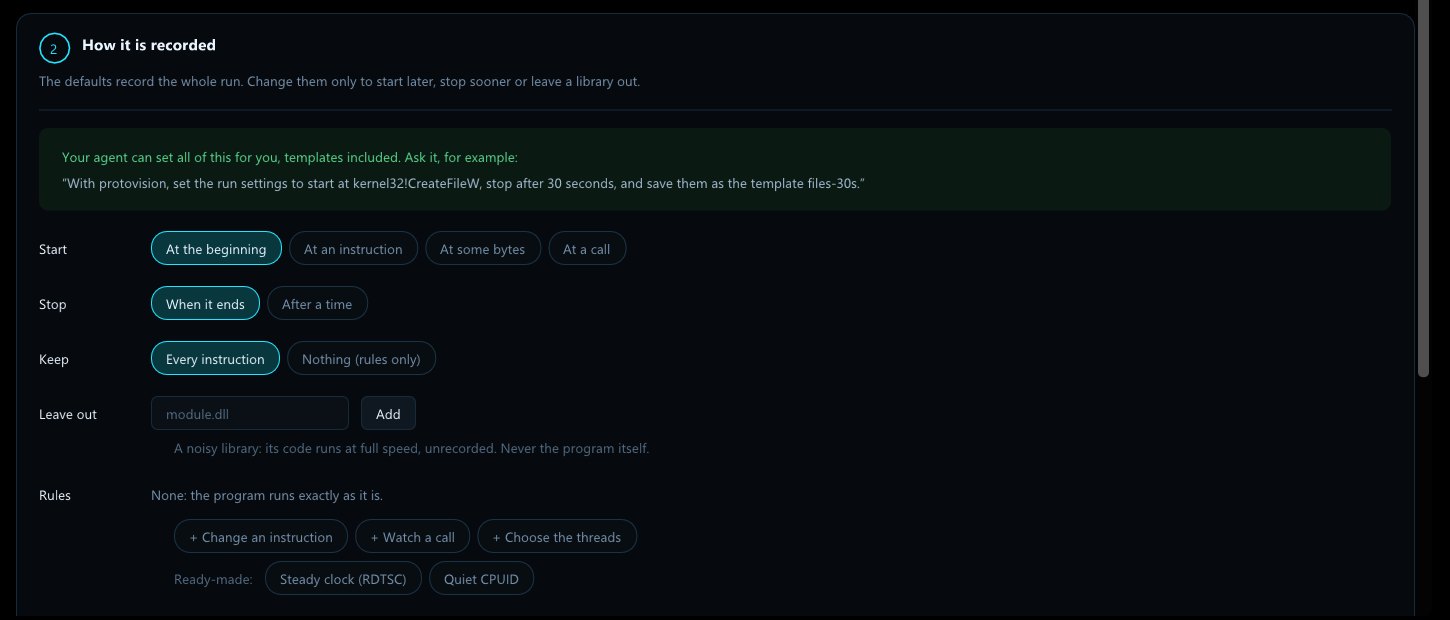
- 2Advanced settings ▼ beside Record opens how it is recorded: start later, stop sooner, leave a library out, change an instruction, with templates. These are the keys of the config file, as fields; the window checks them as you type.
- 3Record. It starts at once. The window shows its output, the threads and the amount recorded live. Close the program, or press Stop: its capture opens in the same window.
Attach
Pick a process in the list (or double-click it). Recording starts now, in every thread, until it exits or you stop it; the capture opens then. The same Advanced settings apply.
Open
Every run of the runs folder, newest first, with the ones opened from elsewhere. A capture that was opened once carries its index and opens in about a second, however big. Right-click a row for more.
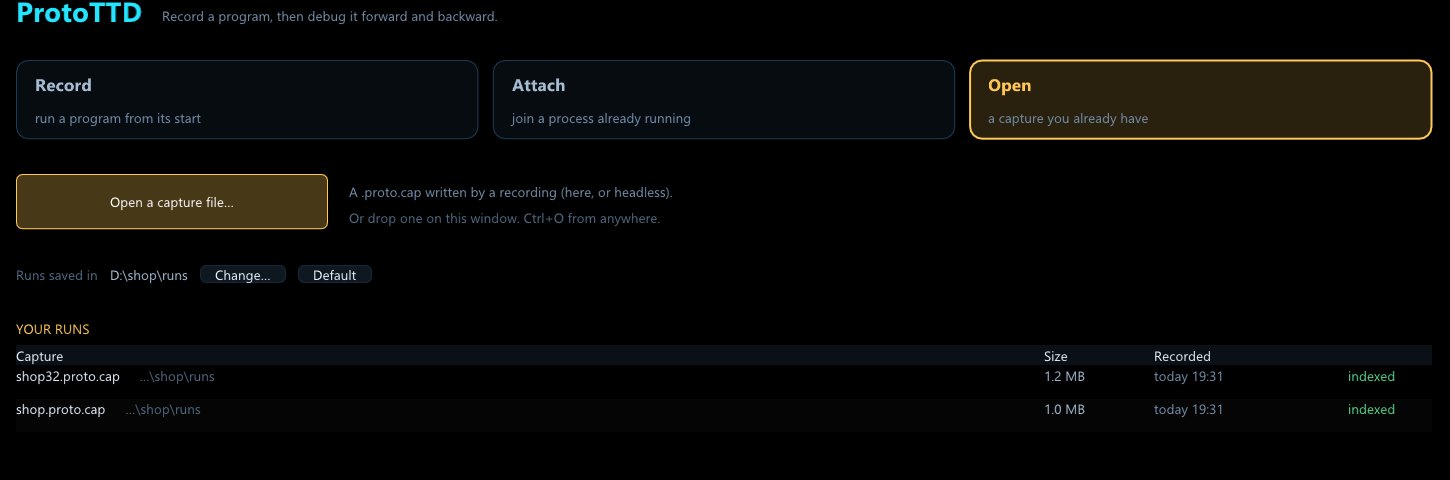
Documents\Protovision\runs: the window's runs, the agents' and the headless ones. The line under Record shows it: click it to open it, Change… to pick another (a large, fast disk), Default to go back. A name already used gets _2, _3… so nothing is overwritten.From a terminal
The same recordings without a window: for scripts, servers and remote machines.
.\ProtoTTD.exe launch C:\tools\app.exe --input data.bin       # from its start
.\ProtoTTD.exe --config run.json launch app.exe                  # with a config file
.\ProtoTTD.exe attach 4312                                       # every thread of process 4312
.\ProtoTTD.exe attach 4312 7720                                  # one thread only
.\ProtoTTD.exe record app.exe # the window, recording at onceWhile it runs, a line every few seconds gives the time, the threads, the speed and the megabytes written. When it ends, the last lines say how the program ended (its own exit, a crash and which, a stop) and where the capture is.
| To… | Do |
|---|---|
| Stop the program and keep its trace | Ctrl+C once: the trace is flushed, then packed. Or "stop_after" in the config. |
| Kill it at once | Ctrl+C a second time. |
| Change where captures go | The window's runs folder, or the PROTO_RUNS_DIR environment variable for one run. |
| Record a 32-bit program | Nothing to do: the same commands, the 32-bit engine is used by itself. |
What is recorded
Every instruction of every thread, with the registers and the memory it read and wrote, Windows' own code included.
The tracer runs the program instruction by instruction and writes down what each one did. Nothing is sampled and nothing is guessed: the debugger later shows the values the program really had. That covers your code, the libraries it loads, and Windows' own DLLs (ntdll, kernel32, KernelBase and the others): when the heap moves a block on realloc or an API fills a buffer, the copy is in the trace. Code generated at run time (a JIT, an unpacked payload) is recorded too.
What always runs natively
A few Windows functions run outside the tracer, call included, because the tracer must not be inside them: ending the process or a thread (ExitProcess, ExitThread, TerminateProcess, FreeLibraryAndExitThread), raising an exception and unwinding (RaiseException, RtlUnwindEx, RtlRestoreContext, NtContinue) and, in a 32-bit program, the gate its system calls go through. What they do is not in the trace; the program goes on recorded where they return or where the exception is handled. The kernel's side of a system call is never recorded: the bytes it writes appear when the program next reads them.
"exclude_modules" in the config runs other libraries natively too: smaller captures, faster runs, for a library that only adds noise. The config file.Speed and size
A recorded program runs several times slower than usual and writes gigabytes a minute.
On a desktop machine the tracer records a few hundred million instructions a second. A program that waits for you costs little; one that computes all the time feels slower. The capture grows with the work done: a short tool makes megabytes, a JavaScript engine running a test suite for a minute and a half made 20 GB. To keep it small:
- start later with
"trace_from"(a call, an address, a byte pattern), or stop sooner with"stop_after"; - record only the threads that matter with a thread rule;
- put the runs folder on a disk with room, and keep Windows Defender off it (Troubleshooting).