 Protovision
 in five minutes.
Protovision records everything a Windows program does, once, while you use it. Then you go through that run as often as you like: forward and backward in a debugger, or by asking an AI agent what the program did. The recording stays on your machine. Everything you do yourself is free; an agent pays 0.25 credit per question it asks.
What do you want?
Download
One zip with every program, for 64 and 32-bit Windows. No installer.
Right-click the zip, Extract all, and open the folder. ProtoTTD.exe is the program you start with.
Record a run
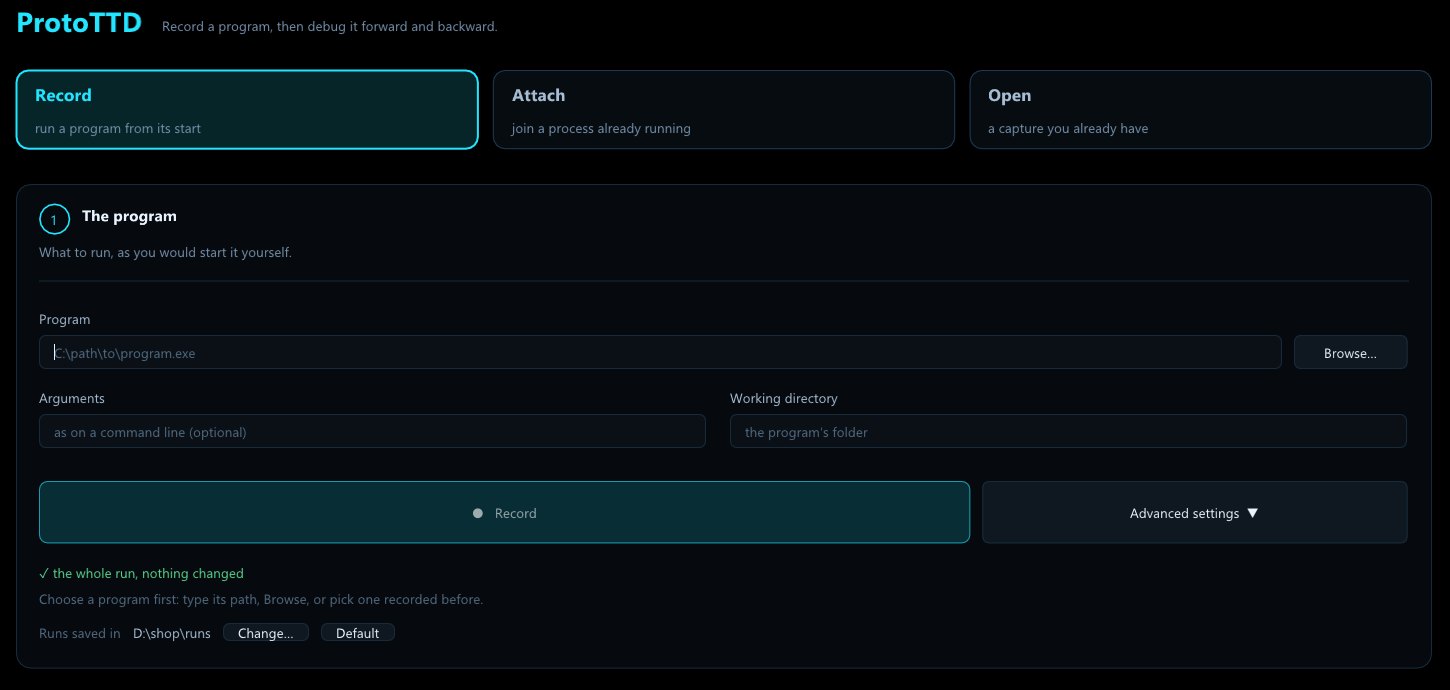
Start ProtoTTD, press Record, use the program, close it.
- 1Open ProtoTTD.exe. Its front page has three tabs: Record, Attach and Open.
- 2Pick the program with Browse…, add its arguments if it takes any, and press Record.
- 3Use the program as you normally would: the window shows what it prints and how much has been recorded.
- 4Close it. The recording is written and opens in the same window, ready to debug.
The same without a window, from a terminal in the folder:
.\ProtoTTD.exe launch C:\path\to\app.exe arg1 arg2 # writes app.proto.capDocuments\Protovision\runs, named after the program (app.proto.cap, then app_2.proto.cap…). The Open tab lists them all. The folder can be changed on the Record tab; a big disk is a good idea, since a run grows by gigabytes a minute. Recording has the detail.Debug it, forward and backward
The capture opens on the first instruction. Move with the keys you know, and Alt to go back.
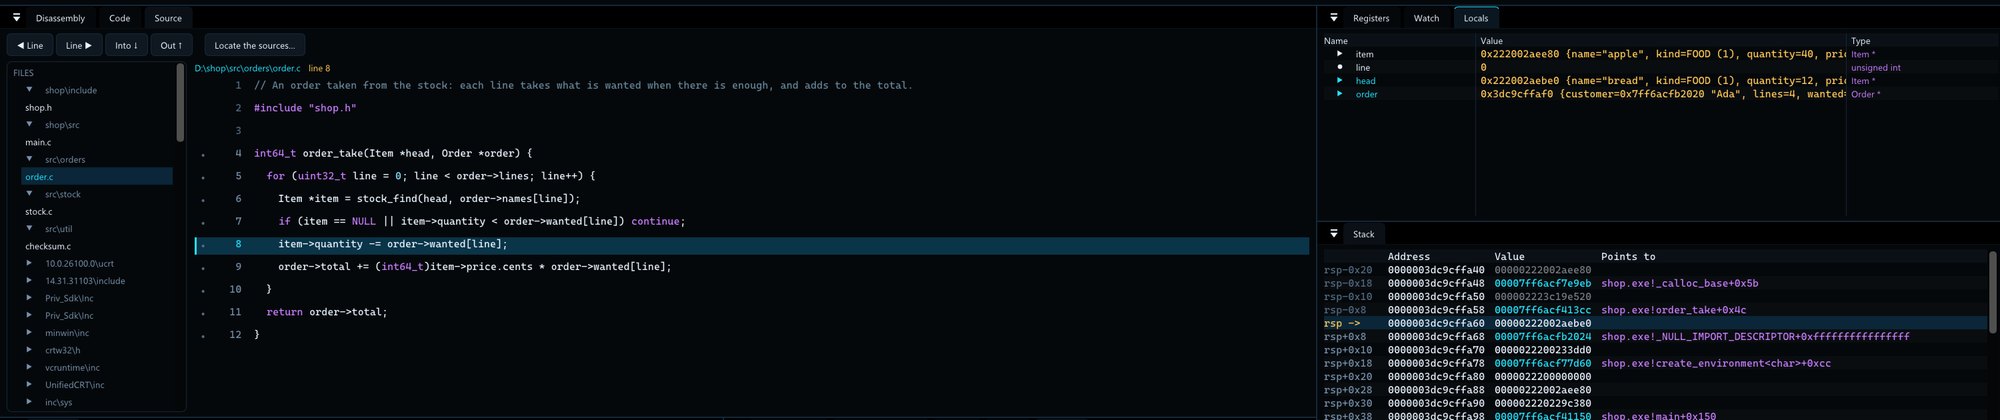
F11  step into          Alt+F11  step back
F10  step over          Alt+F10  step over, backward
F5   run to a breakpoint Alt+F5  run backward
Shift+F11 step out Ctrl+P go to #5000, a mark, or the next run of a functionRight-click any address, register or value for what you can do with it: follow it in memory, find who wrote it, break on it. With the program's PDB beside it you get its source lines, parameters and locals, typed. The prompt version, WinDbg style:
.\ProtoTTD.exe app.proto.cap
0:0> bp kernel32!CreateFileW
0:0> g
0:0> calls app!parse_header max 20All of it in Debugging.
Let an agent work on it
Sign the window in, give its link to Claude, and ask.
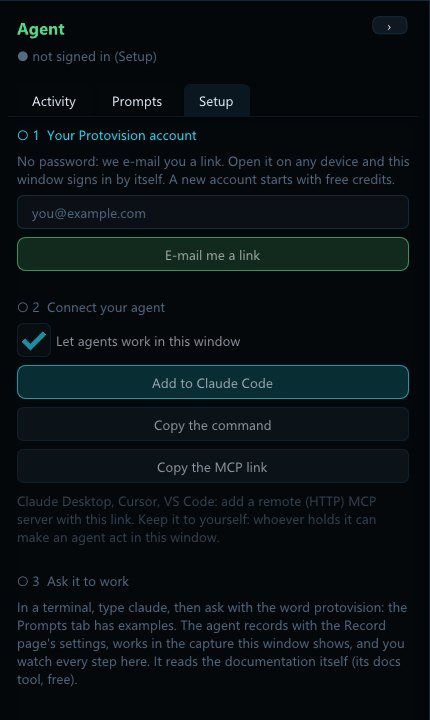
- 1Open the agent pane (the Agent button, top right) and type your e-mail: we send you a link, no password. A new account starts with 200 free credits.
- 2Open the link on any device: the window signs itself in.
- 3Add to Claude Code in the pane does it for you; for another client, copy the MCP link and add it as a remote (HTTP) MCP server.
- 4Ask, with the word protovision. The pane's Prompts tab has examples; here are two.
claude mcp add --transport http -s user protovision <your MCP link>
claudeWith protovision, open my latest capture and summarise what the program does, thread by thread.
With protovision, record C:\Windows\System32\notepad.exe for 20 seconds, then list the files it opened.
The agent records, debugs and runs Python in your window; you see every step. For a long analysis by a fleet of agents, with a written report at the end, see Agents and prompts.