 Protovision
Debugging
In short: open a capture in ProtoTTD and move through the run as in any debugger, except that every command also goes backward. Nothing runs again: each value is read from the recording, so a step back is as exact as a step forward.
The window
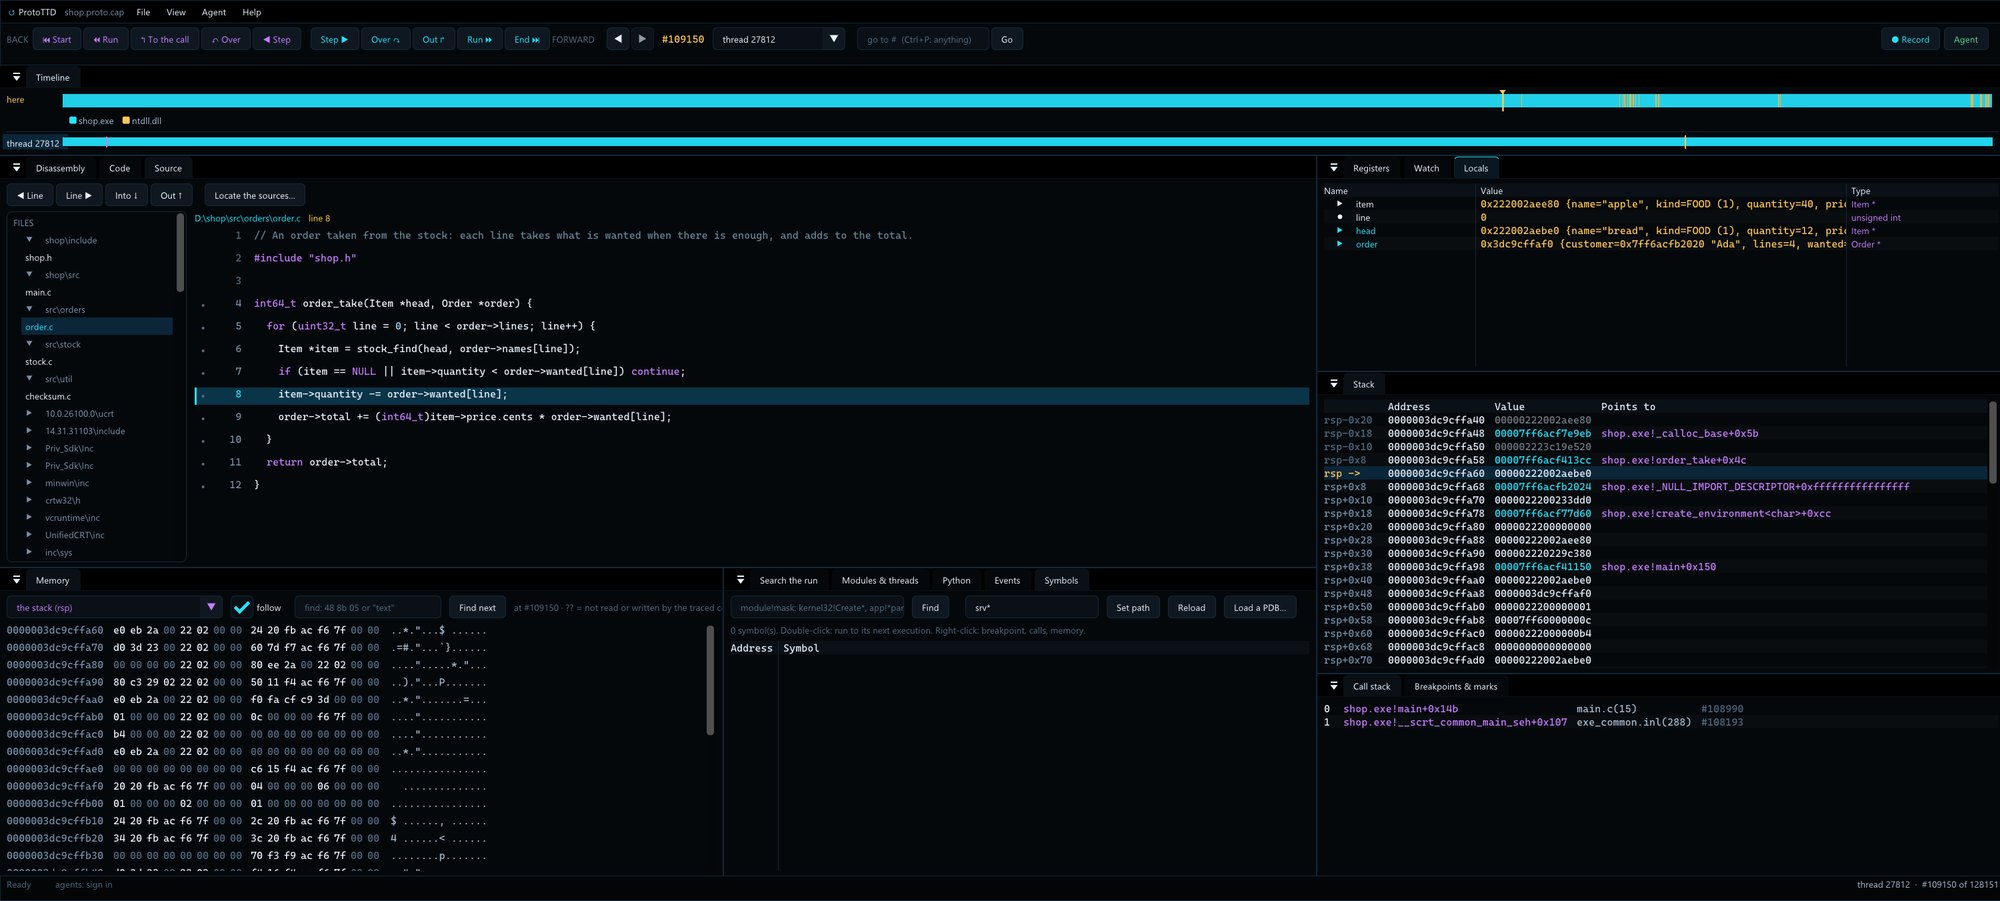
A capture opens on its first instruction, with the threads on a timeline and the code as it ran.

| Key | Forward | With Alt: backward |
|---|---|---|
F11 | Step into | Step back |
F10 | Step over a call | Step back over a call |
Shift+F11 | Step out of the function | Back to where it was called |
F5 | Run to the next breakpoint (or the end) | Run backward to the previous one (or the start) |
Ctrl+P | Go to #5000, thread 1234 #5000, a mark, or the next run of an address or function (Shift+Enter: the previous) | |
Alt+← / Alt+→ | Back and forth through the places you visited |
The panels: the timeline of every thread, coloured by module; the disassembly of the thread as it ran (the wheel steps through it); the code at any address; registers, the stack and memory at this instant; source, parameters and locals from the PDB; the events of the run; searches over the whole run; watches; and a Python panel.
The prompt
The same debugger as text, WinDbg style: for a terminal, a script, or an agent.
.\ProtoTTD.exe app.proto.cap
0:0> bp kernel32!CreateFileW
0:0> g                       # to the first call
0:0> k                       # how it got there
0:0> gu-                     # back to the caller, before the call
0:0> who rcx # the last write to the bytes rcx points to| Command | What it does |
|---|---|
t [n], t- [n] | Step forward, backward. |
p, p- | Step over a call, forward and backward. |
g, g- | Run forward, backward, to a breakpoint or the end. |
g <a>, g- <a> | To the next, the previous execution of an address. |
gu, gu- | Out of this function, forward; back to its call. |
pl, pl- · tl, tl- | To the next, previous source line: over calls (pl), into them (tl). Needs the PDB. |
!tt C:I | Travel to an instant. |
bp <expr> [if <cond>] [pass <n>] | A breakpoint, only where the condition holds, at the n-th time. bl, bc, bd, be list, clear, disable, enable. |
ba <r|w><n> <a> | Stop on an access to memory. |
mem <a> [L n] [r|w|rw] | Every access to those bytes in the run: when, thread, value, by whom. |
who <a> [L n] | The last write to those bytes before here. |
calls <f> [max n] | Every call to f: its arguments and its return value. |
r [expr] · db dd dq <a> | Registers; memory at this instant. |
u [n] · uf <a> | The next instructions executed; the code at an address, as it ran. |
k · dv · dx <path> | Call stack (with source lines); parameters and locals, typed; a value and its fields. |
.line · lsa [where] [n] | The source file and line here; the source around here, a function or file:line. |
s <a> L<n> <hex>|"text" | Search memory as it is now. |
mark <name> · jump <name> | Keep an instant, come back to it. |
lm · ln [a] · x <mod!mask> | Modules; the nearest symbol; find symbols. |
~ [id] | Threads; switch to one. |
$$< <file> | Run a script of commands (# comments). |
.sympath · .reload · .srcpath | Where symbols come from; load them; where sources moved since the build. |
Expressions
Addresses, registers, symbols and C, in any command that takes an address or a condition.
| Write | Means |
|---|---|
app+0x1000 · app!parse_header | An address in a module; a function by name. |
rsp+8 · poi(rsp+8) | Arithmetic on registers; the pointer read at an address. |
`order.c:9` | A source line: bp `order.c:9`, g `order.c:9`. |
order->total · names[i+1] | A parameter, a local or a field is its value, as in C; indexes can be expressions. |
&order->total | Where it is. In db, dd, dq, who, mem and ba, a variable names where it is. |
0:0> bp `order.c:7` if item == 0
0:0> ? order->total
0:0> who order->totalSource and types
With the program's PDB, the debugger works in your source: lines, parameters, locals, structures, globals, bit fields.
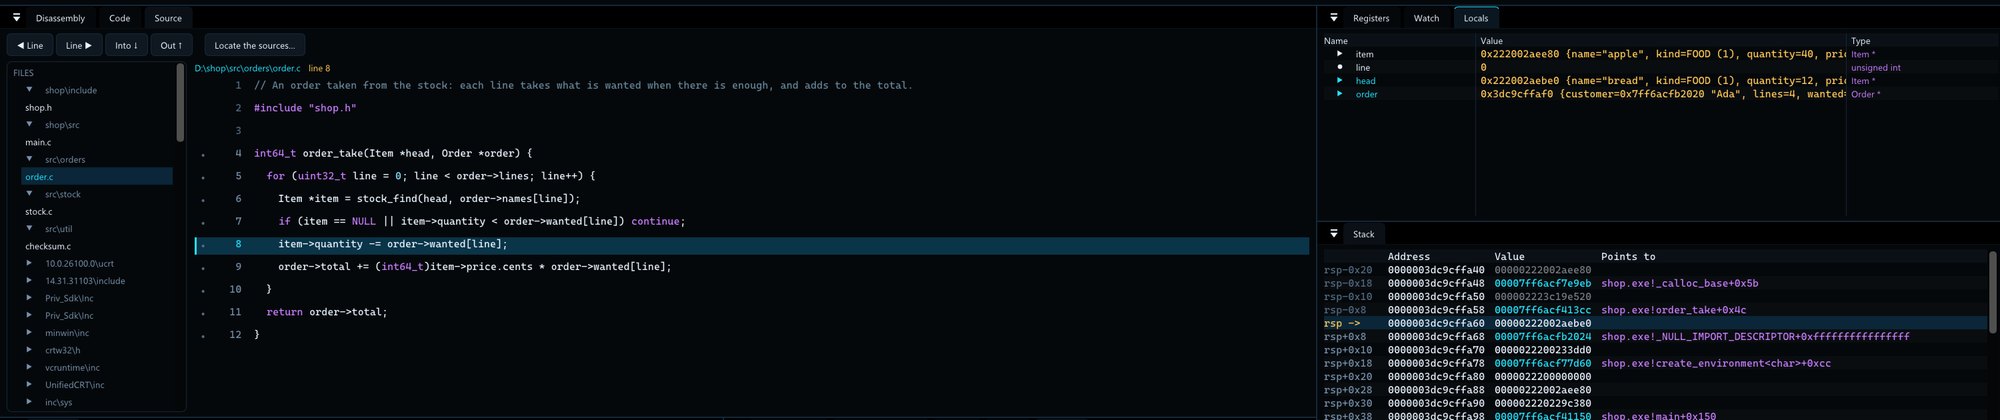
The PDB is found beside the program or where the build wrote it. .sympath srv* adds Microsoft's symbol server for Windows' own DLLs. When the sources have moved since the build, .srcpath <folder> (or the Source panel's folder button) says where they are now; .files lists what the PDB names. 64 and 32-bit programs alike; several source files and folders are fine.
Python
The whole debugger as a Python module, in the window's Python panel or in your own scripts.
import protottd
t = protottd.attach()                     # the window that is open (its Python panel does this for you)
t = protottd.open("app.proto.cap")        # or a capture, without a window

t.run_to("kernel32!CreateFileW")
print(t.wstring("rcx"), t.source, t.regs.rax)
for c in t.calls("kernel32!CreateFileW"):
    print(c.at, c.args, c.ret)
t.last_write("rsp", 8)                    # who wrote these bytes last
for v in t.values: print(v.name, v.type, v.text)
t.value("order->names[2]").text
t.breakpoint("order.c:9", condition="item == 0"); t.run(back=True)python\protottd.py is in the zip; its first lines list every call. For other languages, ProtoTTD.exe app.proto.cap --ui takes one JSON request per line and answers one per line: the same operations.